The latest stats
We've released our reporting statistics from the 2021/22 season.
- 610 incidents reported to Kick It Out over the 2021/22 Season.
- 380 of those were related to the professional game.
- 159 came from grassroots.
- 74 were related to incidents on social media.
Using the last comparable season 2019/20 (as the pandemic curtailed attendance at a professional level, and grassroots games were on/off for most of the 2020/21 season), in the 2021/22 season we have seen a 41% increase in reports from the grassroots game, with an 8% drop in reports overall.
On social media, we saw a 38% drop in social media reports, between the 2019/20 and 2021/22 season.
A lot of work has been done to tackle online abuse in the past 18 months, including the introduction of a monitoring platform by the Premier League, as well as a Football Online Hate Working Group established in 2021 by Kick It Out which has addressed processes around sanctions and enforcements, as well as communications and campaigns.
We will continue to work with our partners in football to address any online abuse and push for the Online Safety Bill to be completed when Parliament returns from recess in September this year.
For the 2021/22 season, there was a relatively even spread of reports (averaging 60 reports a month, August 21 to May 22), with small peaks in January 2022 and March 2022. Possible reasons for this are the volume of professional games played in January (with the start of the FA Cup 3rd round), and several rearranged fixtures falling into March.
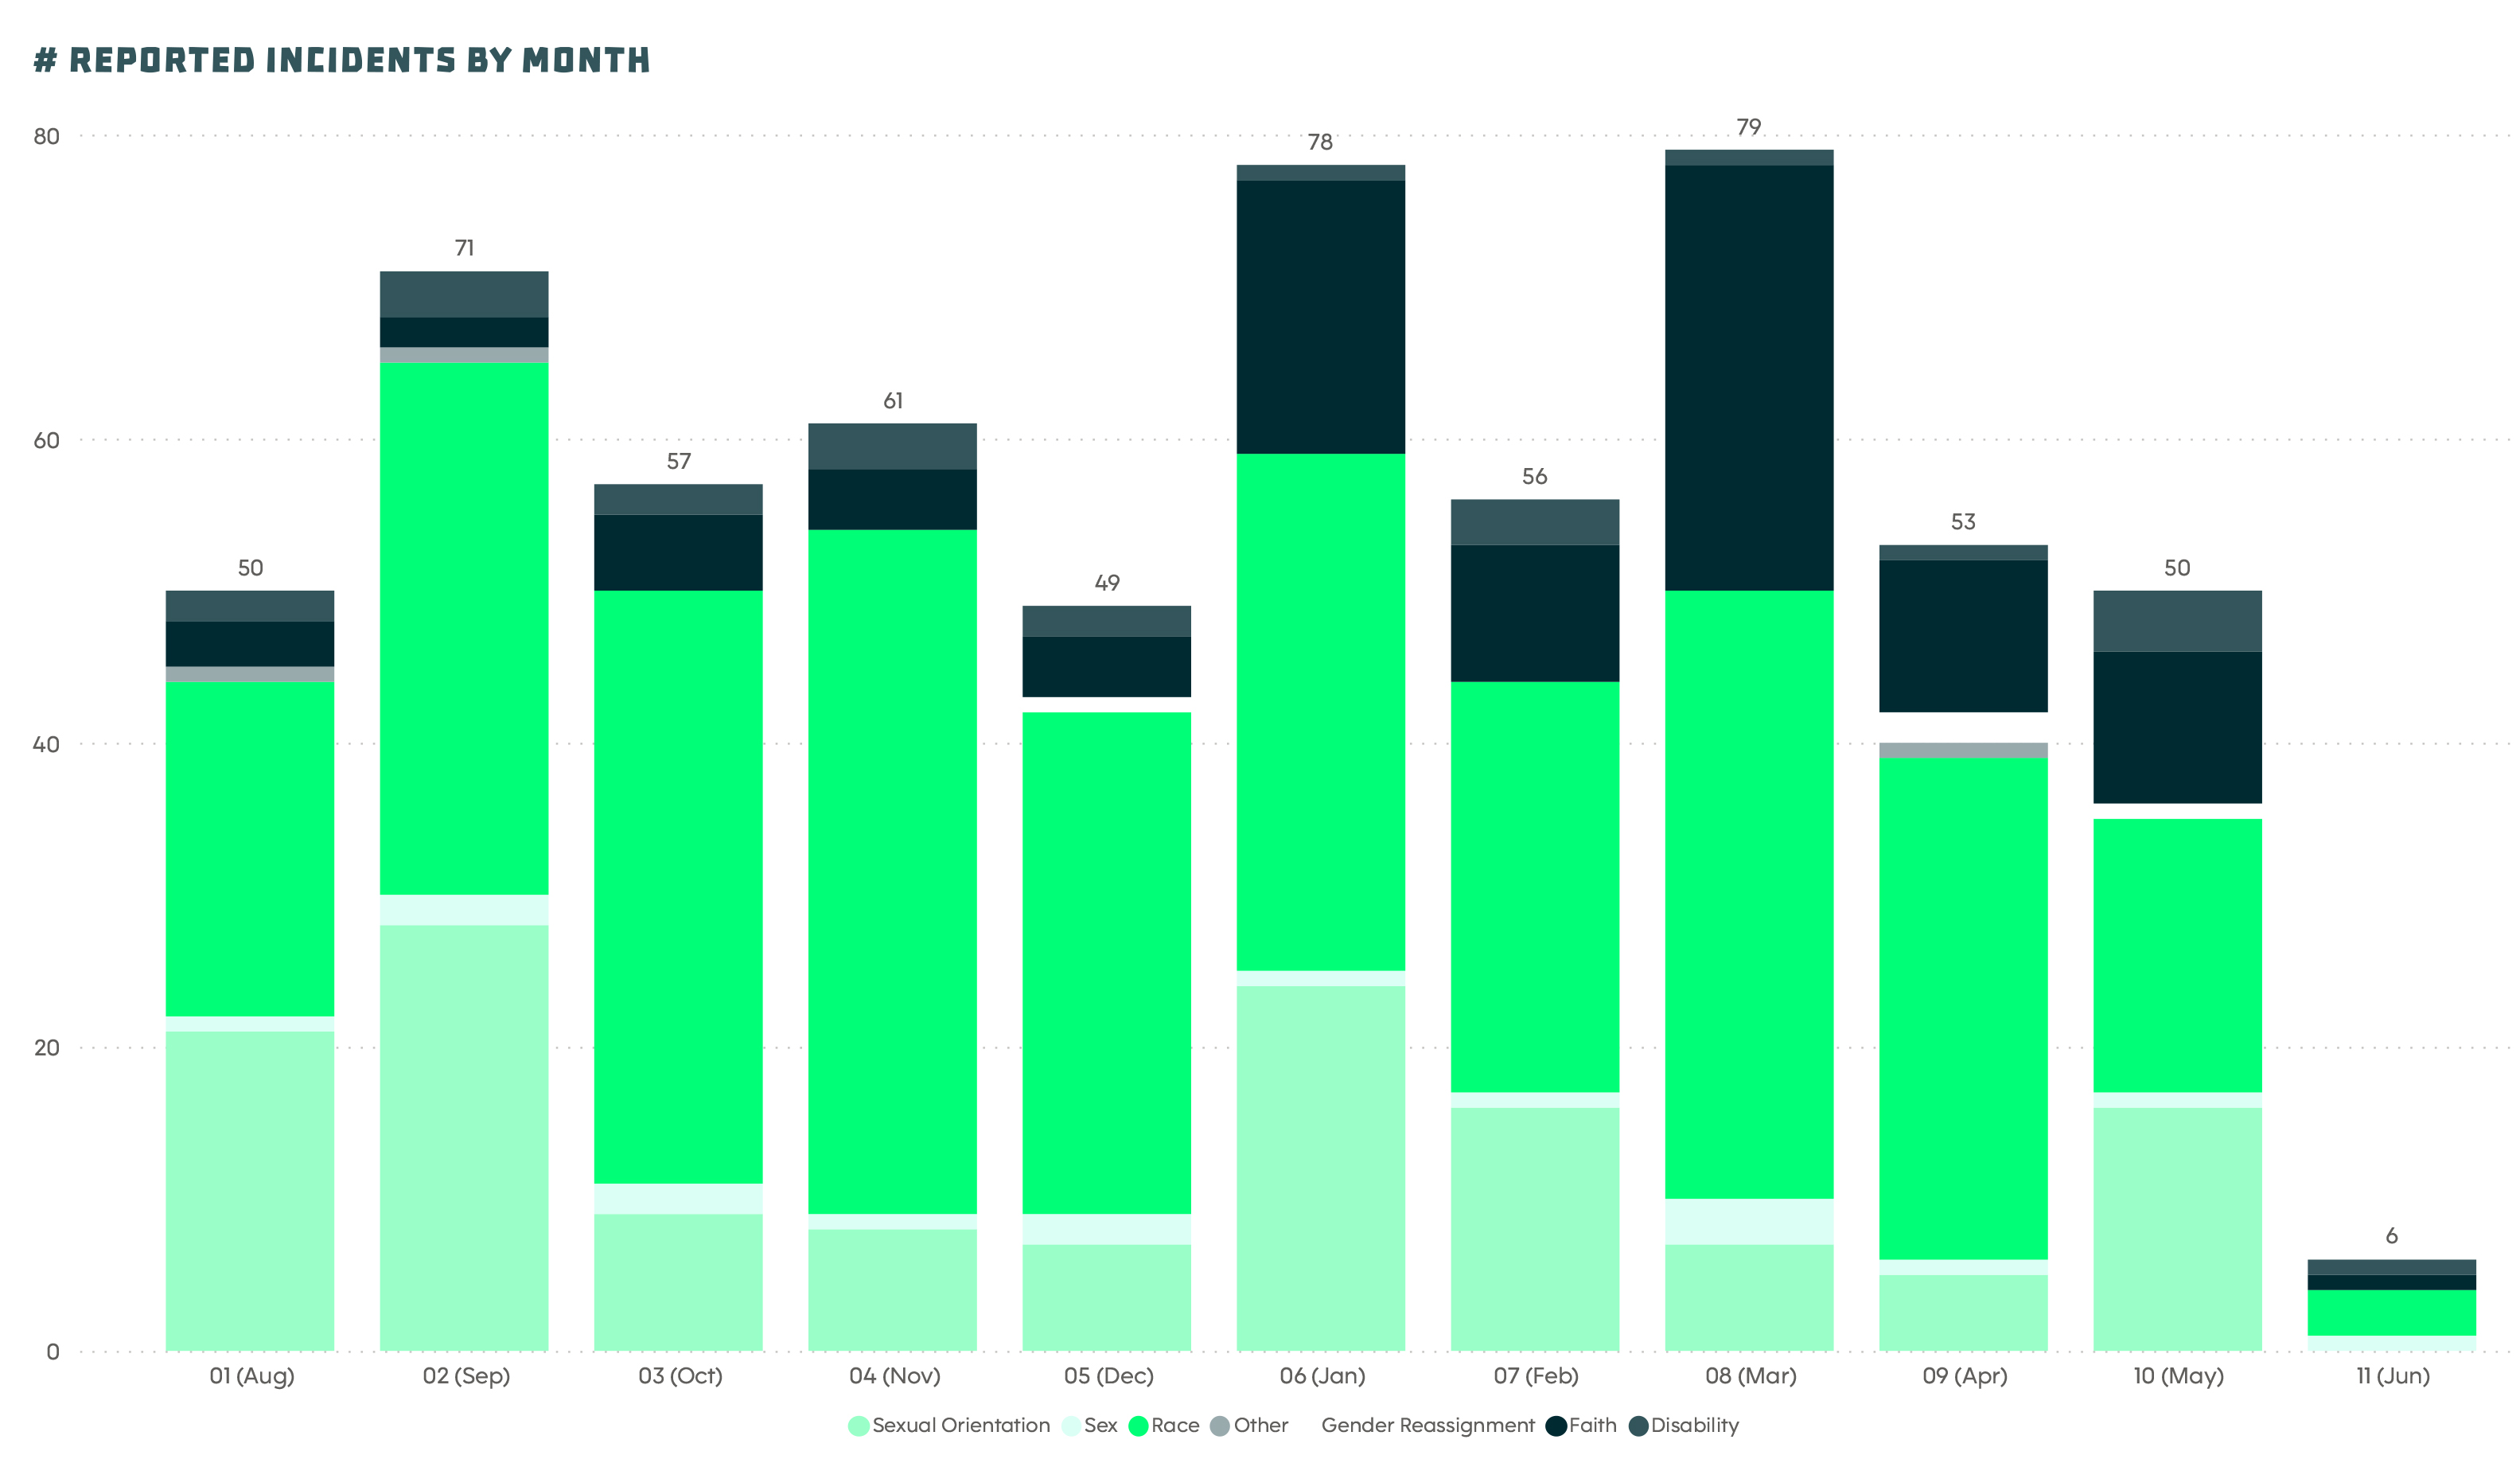
The chart above shows that reports of racism are again the most common, accounting for 54% of reports (329 reports).
We also looked at the type of abuse captured, with fan-on-player being the most common and accounting for over two fifths of all reports received (43%). The other leading type of abuse reported was fan-on-fan, which consisted of 30% of the incidents reported.
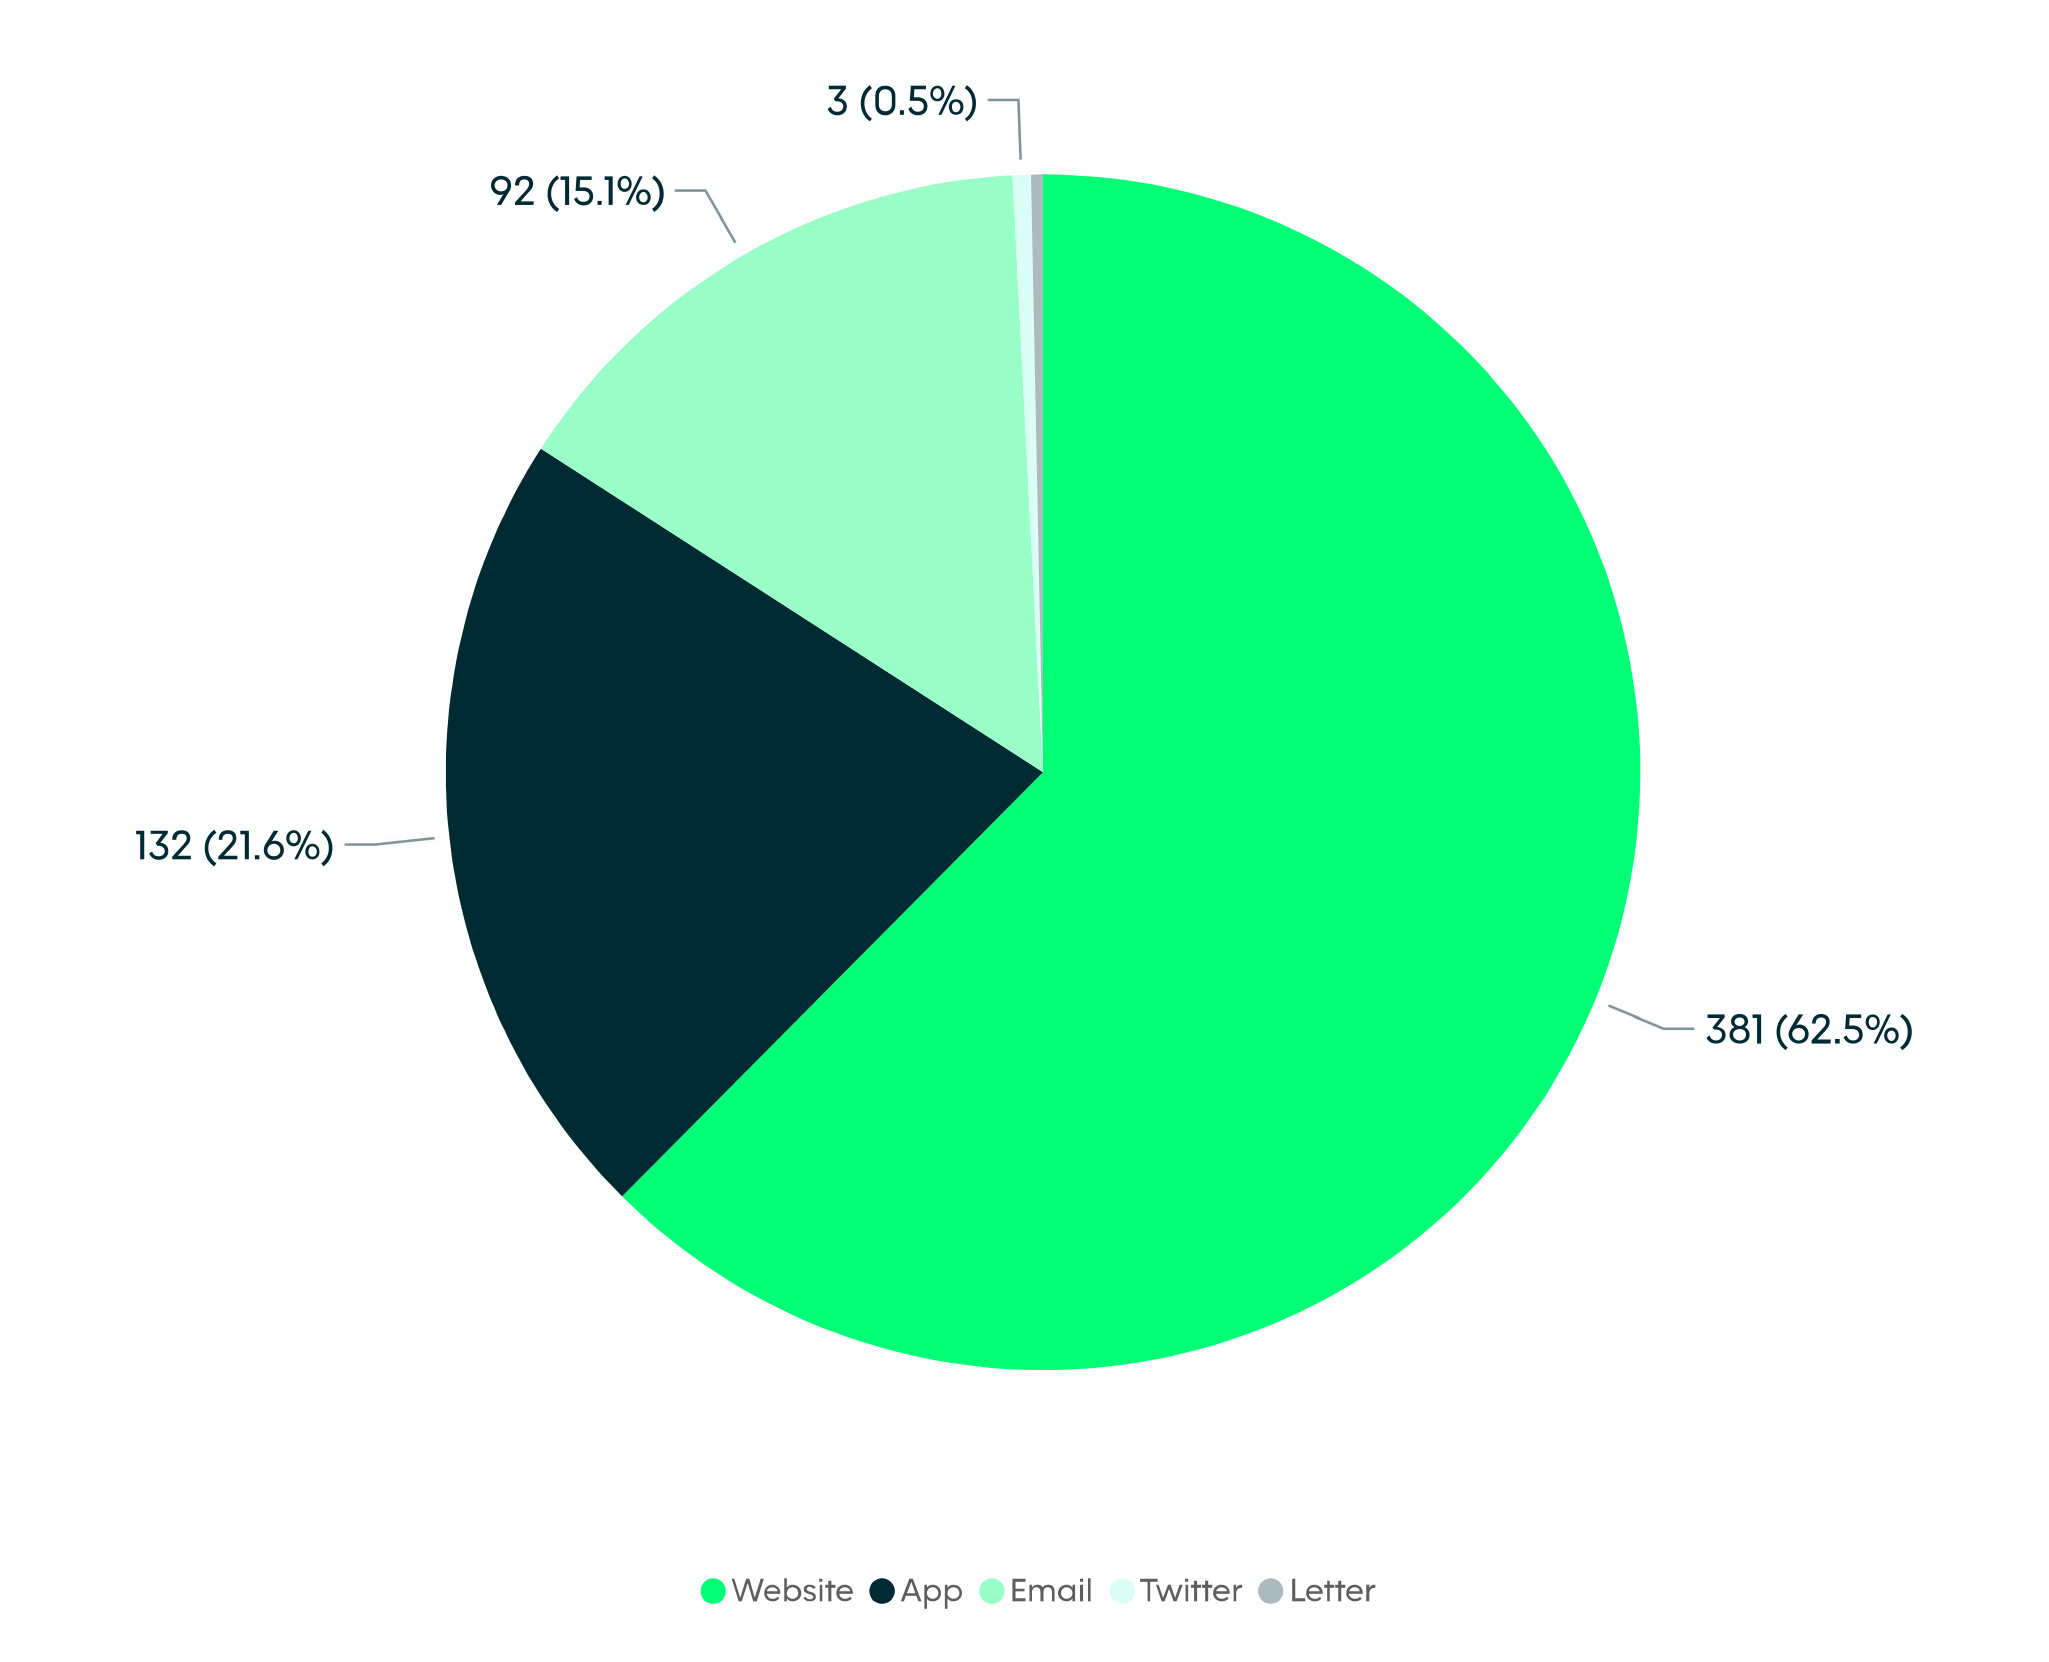
The Kick It Out website remains the most popular way overall of reporting incidents of discriminatory abuse, as broken down below.
Professional Game
- 62% of reports received from professional fixtures, came from the Premier League (234/ 380). The number of reports tapers down per league, as is maybe to be expected with lower attendances, and lower media coverage.
- 54% of reports were race related, followed by sexual orientation at 28% and religion/faith at 18%
Grassroots
- Most incidents reported from the grassroots game continue to be race related (just under 70%). Followed by sexual orientation (15%) and disability (9%).
- Overall, reports of discrimination from the grassroots game are up 41% for the 2021/22 season (with 156 reports) compared with the 2019/20 season (94 reports).
Social Media
- 50% of the incidents reported from social media last season were race related, which is down on the 82% from 2020/21 and the 60% in 2019/20. Religion and faith accounted for 32% of reports, followed by sexual orientation at 12%.